

Science Worksheets for Kids
Science Worksheets for Tracking and Measuring
These science worksheets for kids make recording science experiments simple. Specifically designed for different ages, each worksheet provides a format for your young scientist to track their findings. Log rainfall levels, detail observations day after day, or outline a science experiment from question to conclusion. Fun designs and clear labeling mean our free science worksheets are great for kids, while parents and teachers appreciate that they help science projects easily integrate into a day.
Free Physical Science Worksheets and More
Print out physical science worksheets, earth science worksheets, and those created for specific grade levels. Get help teaching science to children and encouraging their interest in the world around them. Designed to keep children’s interest, you’ll find our kindergarten science worksheets perfectly age appropriate. As kids get older and able to do more in-depth science experiments, they need the extra sections like those included in our 5th grade science worksheets. Easily printable and always free, our worksheets for kids make teaching everything from physical science to life science easier to implement and to track.
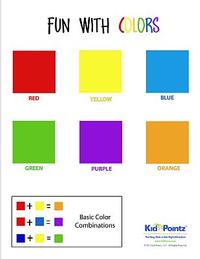
Learning colors is a big milestone for most preschoolers, so make it fun and interesting by printing a free Colors Worksheet. This worksheet displays squares of the basic colors that include red, yellow, blue, green, purple, and orange. The worksheet, however, takes it a step further and shows what happens when colors are mixed. Your preschooler will not only learn their basic colors, but they are going to learn how different colors are made when mixed. Make sure to grab the crayons when working on learning colors, and use them to reinforce what the colors look like. Now that you have learned some basic colors, head outside with chalk or paint, and see what other colors can be made, because, after all, playtime is the best way to learn. Keep this sheet next to the arts and crafts area, so your preschooler can continue to reference it when coloring or painting. Once your preschooler masters their basic colors, move them onto other colors and combinations by either adding to the worksheet to include colors such as black and brown or have the child make a new chart to include the new colors that they have learned to create and recognize.
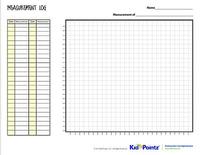
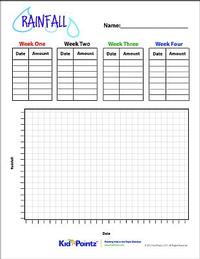
Data is one of the most vital parts of an experiment and what better way to teach a budding scientist how to organize data than with a free printable measurement log worksheet. Whether the young scientist is measuring rainfall, plant growth, or has data from a simple experiment, the worksheet is designed so the scientist will not only be able to record their data in a table, but they will be able to create a graph too. This allows the young scientist to visualize the data in different forms. The measurement log worksheet was designed to give the budding scientist a taste on how experiments are performed and a way to present data in different forms. The young scientist will gain a sense of importance by using charts as actual scientists use, and it will give a greater depth to their overall project. This worksheet can easily be printed and used in the classroom for upper elementary students, but it can be easily printed at home to help keep a young scientist busy and learning while having some fun measuring things around the house. This is a fun way to learn how to conduct experiments and how to present their data in a neat and organized manner.
If you are a parent, it is very important that you were constantly observing your children to see if they are changing it anyway. It is very normal for your children to experience change and for them to change as well. However, it is her responsibility as parents to make sure that their teachers or normal and that their physical and emotional well-being is taken care of every single day. By having and observation record worksheet, you will be able to track down all of your child’s progress throughout the day. You can look back on your child’s progress with in the month, and you can even sit them down to discuss the progress. It is highly recommended that you were letting your child know about his or her progress so that they can remain motivated and encouraged to keep doing better every single day. This can also be something enjoyable to look back on once they are a lot older or once they are adults. It will be nice to look back on the progress or on things that they were working on when they were young children. You can look for an observational record chart online and you can even customize the chart based on your child’s likings and interests. There are many different themes that you can choose from depending on what your child likes the best.
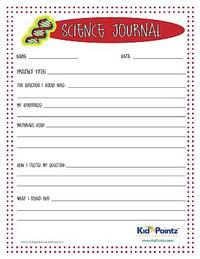
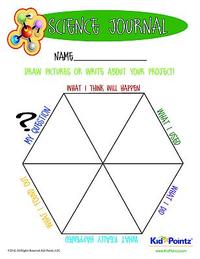
Children's brains are like sponges. They will absorb almost anything that you put in front of them. One of the easiest ways that they absorb information is by observing what is going on. You can take an observation a step further and supply your child with an observation worksheet. This specific worksheet is ideal for scientific experiments. There are a lot of different small science experiments that you can do at home for your child to observe. For example, you could drop and mint in a bottle of Coke and watch what happens. There are six different sections for your child to fill out. One section for what their question is, followed by what they think will happen, then a section for what they used. The other sections will tell what they did, what actually happened, and what they were able to find out. These worksheets can be used at home or in a classroom setting. They are a very easy way to get your child thinking about what they are observing. On this chart, there is plenty of space so your child can draw or write about what they are seeing. Each child is different, so having a versatile worksheet is great for everyone.
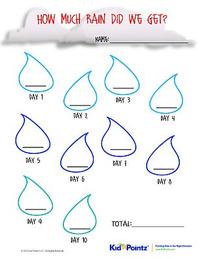
Playing in the rain is always a fun summer activity, but why not add an educational twist to the playtime with a fun printable rainfall tracking worksheet. Gather a few simple supplies from around the house, place the worksheet in a clear protector sheet to help keep it dry and send the kids out into the backyard to learn about the rain where they will practice on a few educational skills such as observation, data collecting, graphing, recording, and prediction. Include a simple lesson on the importance of rain, like rain gives the grass and plants a drink which helps them grow, and a lesson on the water cycle to make it a full easy lesson, and a lesson on time, so they understand how often they need to take their rain measurements. Older children can watch the local weather forecast and see how their measurements relate to those reported on the weather or the child can be the weatherperson and give an account of the day's weather and the amount of rainfall that was measured in the backyard. Learning is better when it is fun, and there is no better time to go out and learn about the environment around us than on a rainy day.
If you have children that are at least 10 years old, there’s activity will definitely be one that will interest you and will interest your children as well. Tracking rainfall can be a very fun activity to do with her children who are at least 10 years old. They are at a good age where they fully understand how the weather works and how rainfall works as well. If you have a child who is specifically interested in science and learning more about the weather, this project will definitely interest them a lot. The first step in this project is making sure that you have a chart where you will be tracking down the rainfall for several weeks. In this chart, you will be labeling how much rain is expected and how much rain we actually received throughout the day. This project can be a lot more enjoyable if you live in an area where you experience a lot of rainfall. You can use this project as a great way to spend some quality time with your soon to be teenager I want to bond with him or her as well. This time is crucial in order to set a good relationship with your child before they enter their teenage years.
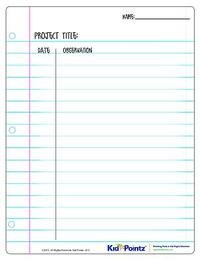
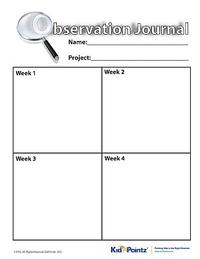
The scientific observational journal is used for any young person trying to complete an experiment. This chart has two sections at the top. The first is where you write your name, and the second is what you are titling the project. This can be a name you have created or the the actual name of the experiment. Each week you can record different observations for the week. These can be purely scientific or simply just something that is noticed easily, such as a change in appearance. As someone conducting the experiment, you want to try to break your findings apart week over week. You want to focus on what has changed from the week prior to the current week. As your research continues, record each week with the intention of potentially referring back to previous weeks as needed. Once you have completed the final week, either finish your findings, or continue on to another page to keep recording. As this chart keeps all of your previous notes organized chronologically, this is a great addition for anyone trying to complete a scientific experiment. Based on the four weeks included, your findings should be able to point you in the direction of coming to the conclusion of a hypothesis.
The idea of keeping a science journal is a fun and inspiring way to teach and motivate children to bring about a better understanding of their environment. The world around us is intimidating and can be confusing. The child under behavioral development is experiencing great cognitive awareness. The idea of keeping a science journal is a great way to break down the big picture into smaller more understandable steps. This will help a child understand the small pieces and where they fit into the bigger picture. This allows them to figure out where they fit in and how they can contribute to this greater good. That is the idea. To have a child understand their place in the world and to be comfortable there. This is what everyone needs in their life. To bring a child under this canopy of comprehension early in life will bring about a deeper understanding, that will lead to a happy purpose-driven life. The child that looks at the world through the scientific principle will see and analytically experience the world. This will lead to developing a life journey that will keep them motivated and entertained throughout their life. The science journal is a healthy way to bring a child into understanding the world in a whole new way, contributing to society along the way.
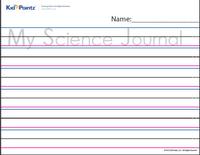
When children start to ask questions, it's time for some science. The inquisitive nature of children makes keeping a science journal easy and fun. A printable science journal chart is a great place to start. The small experiments and observations children can make should be noted for later reference. This a great teaching tool for instructors and a great way for children to learn the value of data. Data that can be used in later experiments and also for reference. The science journal keeps track of the things that children will work on and experiments performed. The whole idea is to get children to save their data and understand why. It creates value in the mind of children for experiments already performed and the results that they reached. This is a valuable learning tool for children to understand. It supports the concept of looking back to see the future more clearly. That is something that installs value for past information. Which is important nowadays with the instant accessibility of the world wide web. It will also reinforce the positive aspects of keeping a journal that records important information and events in a child's life. So use the science journal worksheet to help young minds understand their science data and the reason why. It will install a valuable learning tool for future experiments.
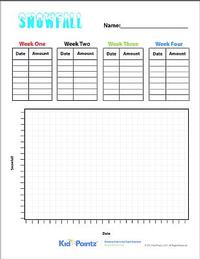
Even the slightest hint of snowfall is enough to cause a lot of conversations about how much there will be and how long it will last. The Snowfall Tracking Chart features blue letters that are topped with an icy design to match the cold weather and precipitation of the winter season along with a line for recording a name as well as plenty of spaces for up to four weeks of recording snowfall totals with each week designed using different colors to make them stand out on the page. Each week on the chart is divided into sections to record the date of when it snows and the amount. At the bottom of the page, there is a graph for plotting the details of snowfall amounts from each week. They can be recorded in any color and then connected to see which weeks had the most snowfall and which ones had the least amount with details for the date are shown across the bottom of the graph with the snowfall totals listed on the side to make plotting as easy as possible. The chart can be customized with any color and can be used year after year to see if any changes can be detected.
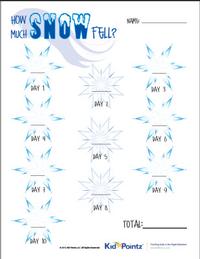
A fun activity during the winter months is tracking the snowfall from week to week or looking to see if there is any snow in the forecast. The Snowfall Tracking Worksheet is a way for children and parents to record how much snow has fallen each day if there is a possibility that snow will be seen during the week. Snowflakes of all shapes and sizes adorn the chart, making it a bit easier for children to remember what they are tracking and to remember that it's the winter season. The words at the top of the chart are blue with a snowy design on top of the words as well. Each snowfall has a day and a number so that parents or children can fill in all of the details about the amount of snow on the ground or the amount of snow shared by a news source. The chart can be used at home for when children are out of school for the holidays in the winter months or can be used in a classroom as the teacher can record the information on the snowflakes for all of the students to see the details, comparing the totals for each day to get a final snowfall amount at the end of the week.
|
|||
 |
|
|||
 |
|
|||
 |
|
|||
 |
|
|||
 |
|
|||
 |
|
|||
 |
|
|||
 |
|
|||
 |
|
|||
 |

 Science Worksheets